For our research, we record a load of game events, including player position, kills, deaths and shots fired. These events all get posted to our server at projectblueroom.com and allow us to create statistics about the game and players. The statistics can be used to monitor things like player skill and can also be used to give players an overview of their game when they've finished.
These overviews are one of the selling points of Project:Blue Room: play through it and see how well you did. A great example of this is the player's position map, which shows how they moved around the level while they were playing:
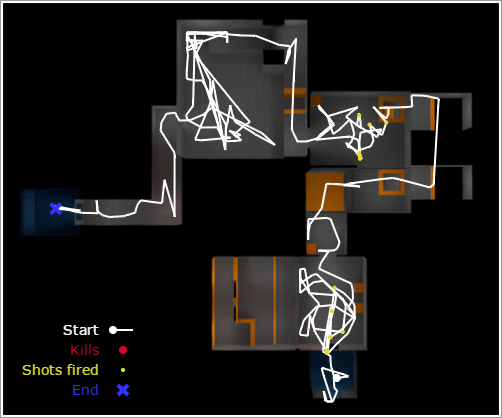
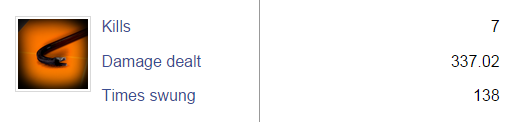
These get more interesting for the later, more complicated levels. Accompanying the position map (shown after a level is completed), is a summary of weapon and enemy statistics, for example:
Another example of the statistics shown is in 'relative performance'. This shows how well a player did (the red line) against everyone else (the blue bars):
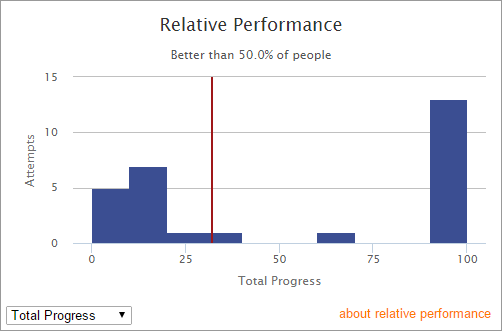
This is a major part of our research in measuring skill and difficulty. Skill can be measured using loads of different performance measures (number of kills, time to completion, etc.), and averaging them over time. There are also other ways of measuring skill like TrueSkill. For our purposes, we take your skill as being your performance compared to everyone else. If you got 80% of the way through the game, but everyone else finished it, then you have a relative performance measure of 0% (or 0.0). And if you got 20% of the way, but no-one else did, you have a relative performance of 100% (1.0). This gives us a nice convenient number between 0 and 1, and tells you how good you really are. For a more detailed explanation of relative performance, see here.
A more global view of playing habits can be seen in heatmaps. These are a common way to visual things like where people die in a particular level. Later in the game's life, we will post an example of where people die on each level. This image shows, as an extension to the first image, where people spend most of their time on the first level:
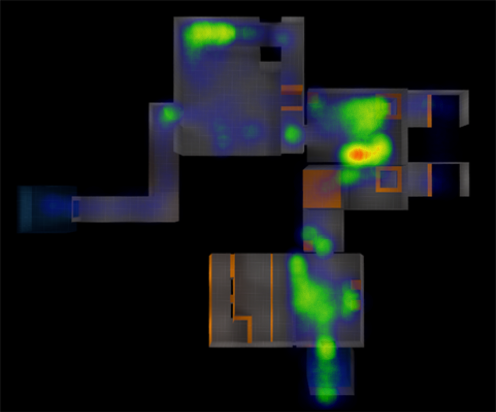
This data is only preliminary, from about 20 people. The more players, the more interesting the data becomes. So please encourage your friends and family to try it out.
There are other things to take into consideration like the game's difficulty, but that will have to come in another post. I will also post something at some point about how the research will pan out, and how we'll use this data to predict your skill.