Mobvista-owned GameAnalytics has just released a comprehensive analysis of the mobile gaming industry.
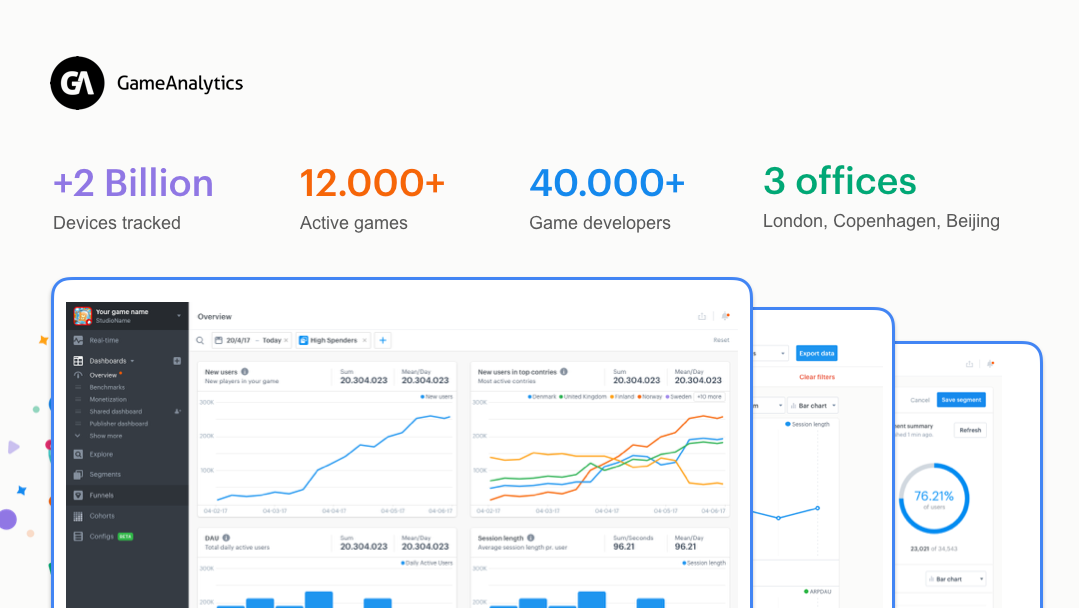
Their data looks at more than 2 billion players across the globe and draws light on a number of performance metrics for the top genres in the app stores.
GameAnalytics is a popular analytics tool used by indie game developers and successful publishers to refine gameplay, improve retention and increase revenue for mobile games.
“The core aim of the report is to draw light on how certain KPIs have shifted over time, so that game developers of all sizes know where to focus their efforts most effectively in 2018,” said GameAnalytics CEO, Jaco Els.
“With these insights, they have the best chance of increasing their share of the predicted $110 billion market revenues in the coming year,” he added.
Key findings
The report examines the movement of important KPIs for game developers, giving insights into key performance benchmarks for key metrics across the top 20 genres:
- Retention (Day 7)
- Average session length
- Average revenue per paying user (ARPPU)
- Stickiness (or DAU/MAU ratio)
- Genres are moving
The top 5 genres on the app store account for almost 80% of the total games analyzed: action, arcade, simulation, puzzle & adventure. Genres have also been shifting in popularity compared to the previous year.
2. Average retention is low, but genre makes a difference
Although many industry sources recommend a day 7 retention of 15%, the industry average is much lower than this, at 4%. The top games have an average 11% retention on day 7.
That said, there are some positives. Four gaming genres have up to 2x better retention than most of the other genres on the app store: Casino, Word, Board and Card games.
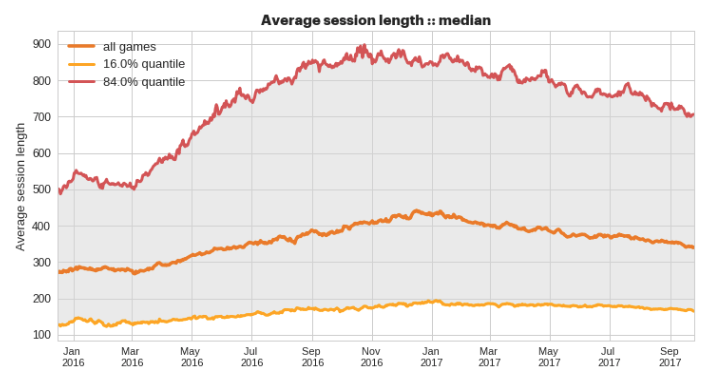
3. The industry average session length is 6 mins
Similarly, whilst the average session length is approximately 6 mins, the top performing games often have double that.
The top 16% of games are played for 11.5 minutes per session, on average. The bottom 16% of games are played almost 4x less with only approx. 3 minutes per session.
4.The best developers are making more money than ever
Whilst ARPPU has only grown slightly for the majority of games, the top performing games have shown an increase of more than 60% since the beginning of 2016.
ARPPU shows the highest gap between high and low performers, with the top games at approximately $50 and the worst performing at just $1.
5. The best performing games are 2.5x stickier than the average
Similar to ARRPU, the difference between best and worst performing games is significant. Top performing games appear to growing at a pace that is accelerating.
In terms of genres, Casino, Card, Board and Word games are almost twice as sticky as others.
Read the full analysis
You can read or download a PDF of the games industry report here.
About GameAnalytics
GameAnalytics is a leading player analytics platform, currently used by 40,000 game developers worldwide, with offices in London, Copenhagen and Beijing.