In working on the FUEL: RESHADED shaders, I needed to see how well performance was improved with optimizations, and how badly enhancements hit it.
In video games, FPS is king, because it's a tangible Key Performance Indicator (KPI) everyone can agree upon that measures a graphics cards throughput and video game's coding quality.
For FPS, you want two things:
- Higher FPS = more responsive visuals
- Smoother FPS = more consistent visuals
Benchmarking
So, I installed MSI Afterburner (a common FPS bench-marking tool), and ran different shader configurations down the same stretch of race course to see what kind of performance came out of it.
MSI Afterburner can log a bunch of metrics, but the key ones folks focus on are
- FPS Avg
- FPS Min
- FPS Max
- 1% Low
- 0.1% Low
The FPS Average is good metric to get a feel for how high our FPS typically stays. The min, max & %'s lows are basically a poor man's way of seeing how consistent / smooth the FPS is in order to catch frame drops and such.
EG:
Game 1:
- 60 Avg
- 55 Min
- 65 Max
- 57 1% Low
- 56 0.1% Low
Game 2:
- 60 Avg
- 45 Min
- 75 Max
- 49 1% Low
- 46 0.1% Low
Comparing the two games above, the 2nd one seems to have more difference between the max and min, which means it has a wider range of performance when generating FPS. The first game is generating FPS fairly consistently, but the 2nd game has areas with frame drops, lag, etc. This can be caused by a number of reason:
- Too many objects in an area require more processing and hit FPS performance
- Some code in an area is not optimized very well, so it's dragging FPS performance
- The player moved to a place that oversees more distance / area, so more things process (this is why many games build in "blinds".. like foliage, corridors, etc to break up areas and prevent large expanses from killing performance).
- Other reasons (too many to list here)
Optimizing FPS Smoothness Analysis
If Min & Max are helping to look at FPS highs and lows, then really what we're worried about is Range...
- Range = Max - Min
The range of a group of plot points (like FPS) tells us how wide they go. So, we can modify our game FPS analysis like this...
Game 1:
- 60 Avg
- 10 Range ( 65 Max - 55 Min )
- 57 1% Low
- 56 0.1% Low
Game 2:
- 60 Avg
- 30 Range ( 75 Max - 45 Min )
- 49 1% Low
- 46 0.1% Low
With Range calculated, we can see a much bigger difference in performance between the two games: the 2nd game has a +20 FPS range compared to the first! So, while they're both averaging 60 FPS, the 2nd game definitely has something going on with it's performance in regards to smoothness.
% Lows = Standard Deviations .. Poorly
But, we can take this a step further. % Lows are basically just relaying standard deviations to people without worrying them with a scary term like "standard deviations" which starts to make them think they're looking at scary statistics stuff they learn in school.
The scary image above is a Bell Curve / Normal Distribution. A Normal Distribution says that if you sample something long enough you end up with plot points that will graph out to look like this...
- not many plot points on the low end
- plot points increase towards the middle
- plot points max out in the middle (average)
- plot points decrease towards the high end
- not many plot points on the high end
Video game FPS performance should ideally graph out to a bell curve. You're going to have an Average of majority performance, and then high's and lows as some areas will have an easier time on the performance while other areas will bog down.
But, if you ignore everything else, there's one thing you need to notice on the bell curve...
The 0.1% Low that everyone's so hot and bothered about is the 3rd standard deviation. It's just folks aren't calling it "3rd standard deviation".
In Deming-style Total Quality Management (TQM) / Six Sigma, anything inside +/- 3 standard deviations is considered inside the control of the process. Anything between the 3rd and 4th standard deviation is considered "outside the process' control".
So, the reason we look at 0.1% Lows is because that's considered the lowest point the FPS can go to be considered "inside the game's control". Anything between the 3rd and 4th standard deviations would be something outside the game's control.. like your computer overheating and causing massive frame drops.

Coefficient of Variation is Better
But, Standard Deviation is still a lame metric to analyze FPS smoothness when we have a much better metric: Coefficient of Variation (CV). CV is a statistical metric who's whole purpose is to track how well plot points hug the average... and FPS plot points hugging the average FPS is how we decide how smooth or choppy a game is.

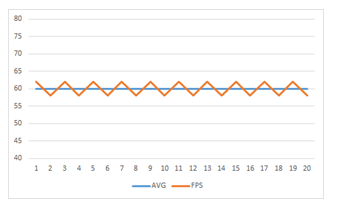
Look at the two charts above. Both games average 60 FPS. But, which game would you rather play:
- the 1st one with FPS performance sawtooth'ing all over the place
- the 2nd one where the FPS is hugging the Average much more smoothly
If we're just analyze FPS performance, you'd obviously want to play the 2nd game.
Coefficient of Variation tells us how badly plot points are hugging or sawtoothing. And, we pretty much have all the numbers we need already in normal FPS performance reporting to calculate it. Let's break it down to see...

How to Calculate
CV is pretty "simple" to calculate once you break it down into component parts, and find out how you can scrounge and estimate components to get it.
- Coefficient of Variation = Standard Deviation / Average
Any decent FPS analysis should already give you an Avg FPS, because that's a gold-standard KPI we measure FPS quantity by. So, all we need to worry about is Standard Deviation.
Standard Deviation
Standard Deviation can get estimated as...
- Standard Deviation Estimation = Range / 4
So, we need to come up with Range.
Using FPS Min & FPS Max
If we have the Min FPS and Max FPS, that's easy...
- Range = Max - Min
So, we can estimate Standard Deviation as...
- Std Dev = ( Max - Min ) / 4
Using FPS Avg & 0.1% Low
If we don't have min / max (EG: someone's only showing you Avg & % Lows), as long as we have the 0.1% Low we can use it as a "close enough" value to Min FPS to generate Range.
We subtract it from Average to get 1/2 the range. That's because the 0.1% Low is the -3rd Standard Deviation. So, from it to the average is only half the bell curve (half the range). The other half of the range is from average to +3rd Standard Deviation. But, since we already calculated half the bell curve, we can just double it. So...
- Range = ( Avg FPS - 0.1% Low ) * 2
But, our Standard Deviation Estimation then divides it by 4...
- Std Dev = ( ( Avg FPS - 0.1% Low ) * 2 ) / 4
We can pre-calculate the 2 & 4 to get a Standard Deviation Estimation as...
- Std Dev = ( Avg FPS - 0.1% Low ) / 2
Putting it Together
So, we can have one of two Coefficient of Variation formulas...
- CV = ( ( Max FPS - Min FPS ) / 4 ) / FPS Avg
... or ...
- CV = ( ( Avg FPS - 0.1% Low ) / 2 ) / FPS Avg
"FPS Smoothness" (or "Making CV Less Scary Sounding")
Coefficient of Variation has two downsides...
- It tracks efficiency in "lower is better" fashion. IE: plot points with 5% CV are hugging the average better then plot points with 20% CV. Most people are conditioned to think "higher is better". IE: getting a 90% on a test is better then getting a 60%. So, trying to tell them that 5% CV is better then 20% CV will get met with confused and frustrated looks.
- If you start slinging a term like "Coefficient of Variation" around to folks, either their eyes start glazing over, or they become flustered at you talking about some high-level nerd stuff they have no clue about.
So, we kill two birds with one stone by inverting the formula, and slapping a more friendly / relevant name on it...
- FPS Smoothness = 1 - CV
So, now we get formulas like this...
- FPS Smoothness = 1 - ( ( ( Max FPS - Min FPS ) / 4 ) / FPS Avg )
... or ...
- FPS Smoothness = 1 - ( ( ( Avg FPS - 0.1% Low ) / 2 ) / FPS Avg )

Example
Let's look at our two example games again...
Game 1:
- 60 Avg
- 10 Range ( 65 Max - 55 Min )
- 57 1% Low
- 56 0.1% Low
Game 2:
- 60 Avg
- 30 Range ( 75 Max - 45 Min )
- 49 1% Low
- 46 0.1% Low
Calculations
Game 1:
- FPS Smoothness = 1 - ( ( ( Max FPS - Min FPS ) / 4 ) / FPS Avg )
- FPS Smoothness = 1 - ( ( ( 65 - 55 ) / 4 ) / 60 )
- FPS Smoothness = 1 - ( ( 10 / 4 ) / 60 )
- FPS Smoothness = 1 - ( 2.5 / 60 )
- FPS Smoothness = 1 - ( 0.042 )
- FPS Smoothness = 0.958
- FPS Smoothness = 95.8%
Game 2:
- FPS Smoothness = 1 - ( ( ( Max FPS - Min FPS ) / 4 ) / FPS Avg )
- FPS Smoothness = 1 - ( ( ( 75 - 45 ) / 4 ) / 60 )
- FPS Smoothness = 1 - ( ( 30 / 4 ) / 60 )
- FPS Smoothness = 1 - ( 7.5 / 60 )
- FPS Smoothness = 1 - ( 0.125 )
- FPS Smoothness = 0.875
- FPS Smoothness = 87.5%
So, now we can just stare at 2 numbers...
Game 1:
- 60 FPS Average
- 96% FPS Smoothness
Game 2:
- 60 FPS Average
- 86% FPS Smoothness
So, we can see that both games are averaging decent FPS, but one is clearly running more smoothly / efficiently then the other.
While most folks know 60 FPS is good for gaming, we just have vague ideas of how smooth things need to be to be considered playable. But, with a Smoothness metric, we could start to sample games and poll gamers to start categorizing Smoothness into categories like:
- > 90% = buttery smooth
- 70% to 90% = playably smooth
- 50% to 70% = choppy
- < 50% = unplayable
(I'm just pulling numbers out of my a** here to demonstrate how things could get categorized).
FUEL: RESHADED Performance Comparisons
With all of this explained, we can look at the performance metrics I generated for various FUEL shader setups.
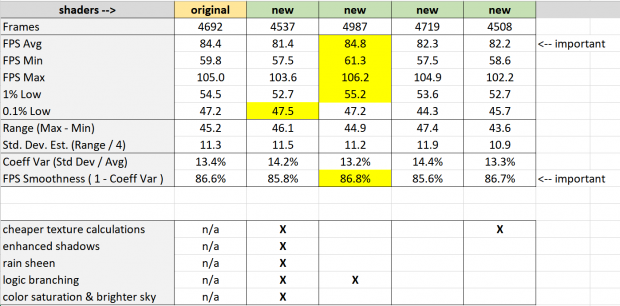
What we see are the usual MSI Afterburner metrics. I call them "metrics", because they are something that was measured. But, our Key Performance Indicators (KPI) are the things flagged "<--important":
- FPS Avg
- FPS Smoothness ( 1 - CV )
A KPI is something that is king when it comes to measuring performance of a process. You can have all kinds of other measurements, but the KPI stand out as the de facto measurements to look at.
The shader setups I ran were:
- Original FUEL shaders
- New FUEL: RESHADED with lots of bells-n-whistles on to see how badly it hit performance
- New FUEL: RESHADED with just logic branching on to see if boolean if/else statements would kill performance (GPU's used to be really bad at logic branching, but more modern ones handle it better)
- New FUEL: RESHADED with no bells-n-whistles to see if any of my optimizations under-the-hood helped performance
- New FUEL: RESHADED with just using cheaper normal map partial derivative equation (Partial Derivitive method gets the .xy of the normal map and uses it to calculate the .x value instead of storing it in VRAM. Asobo was using a euclidean distance type function (sqrt(dot(xy,xy)) to generate the .z from .xy. I messed around and realized I could use a cheaper manhattan distance function (abs(x-y)).
As you can see.. the improvements I made to the code didn't really improve performance much. But, the enhancements I added to the code didn't really impact it too much either.
But, you only know by measuring.
And, you have to measure both FPS Avg & FPS Smoothness.. b/c something I added might have tanked performance every now and then with frame drops.. and if I just looked at FPS Avg I'd never know. And, Min, Max & % Lows are half-a**ed ways to analyze smoothness when we have Coefficient of Variation, which is what CV is designed to do in the first place.
I wish we'd stop using % Low's
MSI Afterburner and other FPS metric trackers / loggers keep tracking tons of metrics, but don't seem to go the extra little step to do CV and just call it "FPS Smoothness". I wish they would. It's just a tiny little more calculation involved, but far more useful.